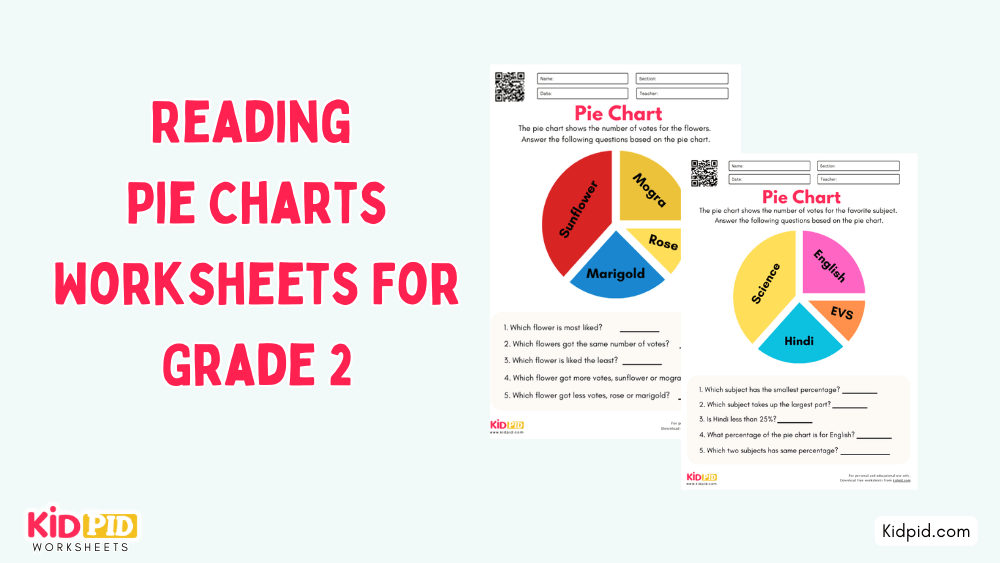
Today, the second-grade students will learn about the pie chart worksheet and analyze the given data based on the pie chart. It shows the number of votes for each item, and the students will answer the questions according to the given data in the pie chart. So, check out these worksheets and learn to analyze pie charts. It will help the students to enhance their critical thinking.
[Scroll Down for Download Link]
Reading Pie Chart Math Worksheets For Grade 2
Read More: Tally Charts Printable Worksheets for Grade 1

Q. Which flower is most liked?
Ans. Sunflower
Q. Which flowers got the same number of votes?
Ans. Marigold and Mogra
Q. Which flower is liked the least?
Ans. Rose
Q. Which flower got more votes, sunflower or mogra?
Ans. Sunflower
Q. Which flower got fewer votes, rose or marigold?
Ans. Rose
This reading pie chart worksheet shows the number of votes for the flowers. Students have to answer the following questions by reading and analyzing data based on the pie chart. It also includes an answer key for the students to correct their mistakes.
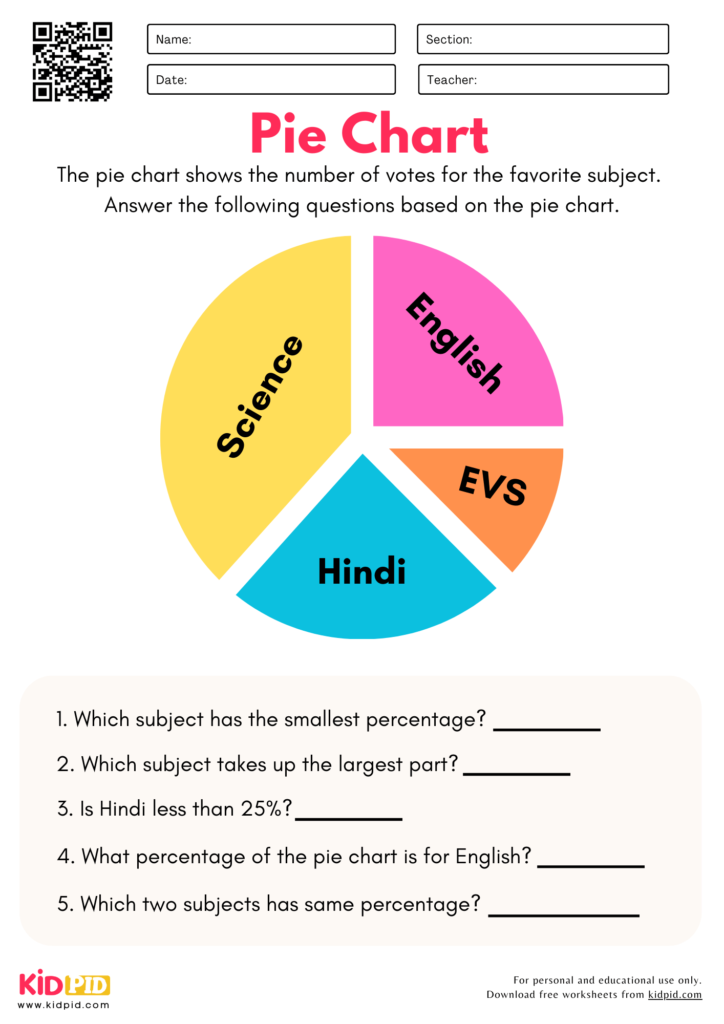
Q. Which subject has the smallest percentage?
Ans. EVS
Q. Which subject takes up the largest part?
Ans. Science
Q. Is Hindi less than 25%?
Ans. Yes
Q. What percentage of the pie chart is for English?
Ans. 25 percent
Q. Which two subjects have the same percentage?
Ans. Hindi and English
Students will practice the worksheet and learn about the pie charts. They will answer the following questions by reading and analyzing data based on the pie chart. It also consists of an answer key for the students to correct their mistakes.
Key Facts About Reading Pie Charts Worksheets
- Target Audience: Designed specifically for Grade 2 students (ages 7-8) to introduce foundational data visualization.
- Skill Focus: Teaches children how to interpret circular graphs, compare quantities, and extract specific information from visual data.
- Visual Learning: Uses colorful segments to help students visualize fractions and parts of a whole, making abstract numbers concrete.
- Cognitive Development: Promotes critical thinking by requiring students to compare, contrast, and answer data-driven questions.
- Educational Alignment: Aligns with standard primary math curricula, focusing on “Data and Graphing.”
Parts, Types, and Examples
- Parts of a Pie Chart:
- The Circle (Whole): Represents the total dataset (e.g., total votes).
- Slices/Sectors: The individual parts that make up the whole.
- Labels/Key: Identify what each color or slice represents.
- Types:
- Numerical Data Charts: Used for counting (e.g., number of flowers).
- Percentage-Based Charts: Introduce the concept of portions out of 100%.
- Examples: Common examples for Grade 2 include “Favorite Colors,” “Fruit Preferences,” or “Time Spent on Activities,” which are highly relatable for young learners.
How Does This Worksheet Work?
This worksheet acts as a guided bridge between looking at a graph and understanding it.
- Observation: Students first observe the pie chart to identify the categories.
- Analysis: They compare the size of the slices to determine which categories are the largest or smallest.
- Application: They answer specific questions (e.g., “Which is the most liked?” or “Which two have the same amount?”) based on the visual evidence provided.
- Verification: An answer key is included, allowing students to self-correct and learn from errors immediately.
Benefits of Learning About Pie Charts
- Simplified Visualization: Helps kids understand complex data in a way that is easier to grasp than text or raw tables.
- Early Logical Reasoning: Encourages students to make evidence-based claims.
- Foundational Math: Prepares students for more advanced graphing and statistics in higher grades.
- Real-World Readiness: Develops the ability to interpret information presented in news, reports, and daily life.
Learning Objectives
By completing this worksheet, students will be able to:
- Identify and read components of a basic pie chart.
- Compare values using visual cues (size of slices).
- Answer analytical questions based on the provided data sets.
- Develop confidence in interpreting graphic representations.
Worksheet Instructions
- Review the Chart: Start by looking at the title of the pie chart to understand the context.
- Read the Labels: Identify what each section of the chart represents.
- Analyze Sizes: Notice the difference in size between the slices to rank them.
- Answer Questions: Read each prompt carefully and write the answer based strictly on the data shown in the chart.
- Self-Check: Use the answer key provided at the end to review your work and check for any missed steps.
Interesting Facts About Pie Charts
- Origin: The first pie chart is often attributed to William Playfair in 1801.
- Visual Intuition: Pie charts are the most intuitive way for humans to understand “parts of a whole.”
- Universal Use: From NASA scientists to teachers in your child’s classroom, pie charts are used globally to simplify data.
Vocabulary Words
- Data: Facts and information collected for analysis.
- Pie Chart: A circular graph divided into slices to show numerical proportions.
- Segment/Slice: One part of the whole pie.
- Analysis: Examining data to understand what it means.
- Percentage: A portion of a whole expressed as a number out of 100.
Real-Life Applications
- Budgeting: Understanding how an allowance is spent.
- Nutrition: Seeing how much of a healthy meal is protein, vegetables, or grains.
- Planning: Helping teachers or parents divide time between different school activities or chores.
FAQs
Q1. Is this worksheet suitable for students struggling with math?
Answer: Yes. The visual nature of pie charts often helps students who find pure numerical math abstract and challenging.
Q2. Can I use this for homeschooling?
Answer: Absolutely! These worksheets are crafted by experienced educators specifically to be used both in classrooms and for home-based practice.
Q3. Why are pie charts better than bar graphs for some lessons?
Answer: While both are useful, pie charts are excellent for emphasizing the relationship of parts to the whole, helping children grasp basic fraction concepts early on.
Exploring pie charts helps Grade 2 students understand how data is divided into parts and compared visually. These worksheets develop graph-reading, observation, and critical thinking skills through fun, hands-on learning activities. Make every lesson more enjoyable with printable flashcards, worksheets, essays, quizzes, paragraphs, and interactive resources. Follow us on YouTube, Telegram, and Facebook.
This worksheet is crafted by our Content Team to support student success.
Reviewed By Poornima Ravi
Read More: