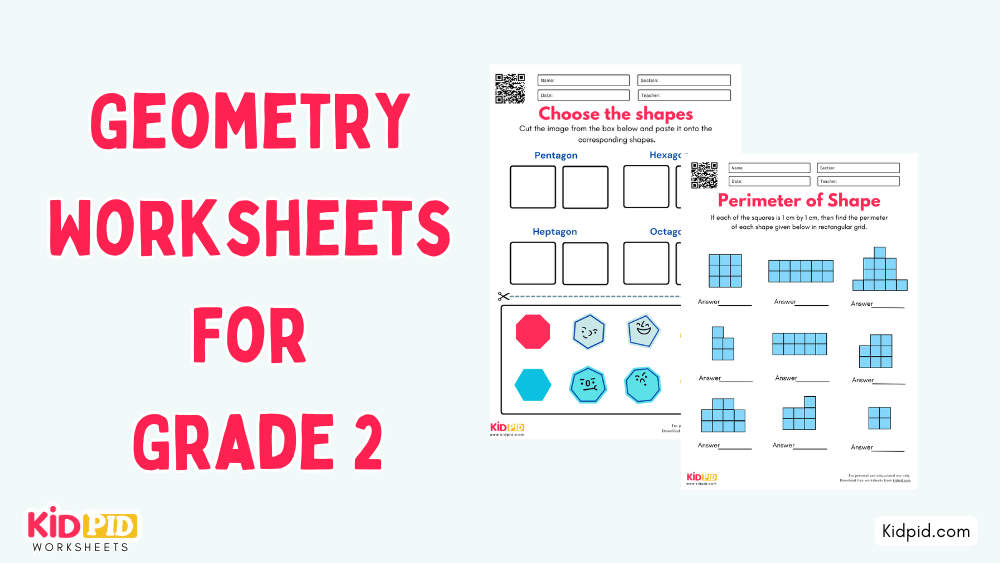
This is a line graph worksheet for Grade 2 students in which they will learn to make a line graph with the help of the given data. The number of classes and the number of working hours are recorded as data to make a line graph using them. So, check out these worksheets to build your knowledge and improve your ability to understand the graphical representation.

[Scroll Down for Download Link]

Line Graph Worksheets For Grade 2 Students

Read More: Add 3 numbers on a number line. Printable Worksheets for Grade 1
Draw Line Graph Worksheet For Grade 2

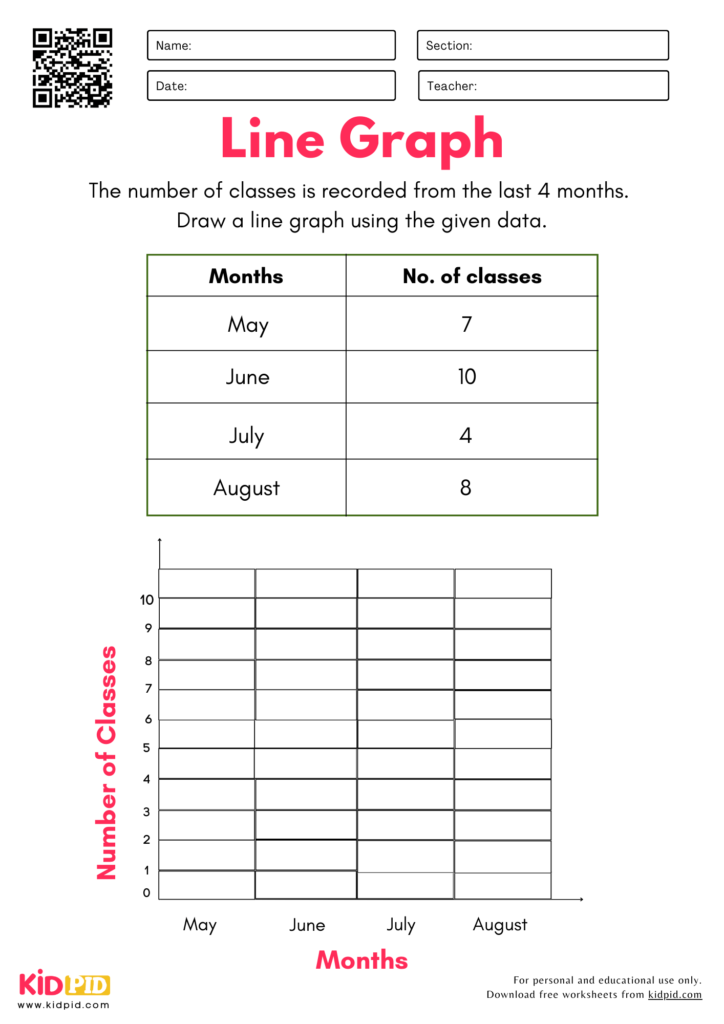
This is a line graph worksheet in which the second-grade students will practice the questions. The number of classes is recorded for the last four months. Students have to draw a line graph using this data on classes and months.

Draw Line Graph Worksheet For Grade 2

This line graph worksheet includes the number of working hours recorded from the last four months. Students have to draw a line graph using the data on working hours and months. They will be able to analyze the graphical representation with the help of this worksheet.

Key Facts About Draw Line Graph Worksheets

  • Target Audience: Designed for 7–8-year-olds (Grade 2).
  • Skill Development: Bridges the gap between raw data sets and visual interpretation.
  • Core Focus: Teaches students to plot points on a coordinate plane and connect them to show trends.
  • Curriculum Alignment: Aligns with standard elementary math curricula, focusing on “Data and Graphing.”
  • Format: Uses real-world scenarios (e.g., temperature, attendance) to make abstract math concrete.

Parts, Types, and Examples

  • Parts of a Line Graph:
    • X-Axis: The horizontal line representing categories (e.g., Months).
    • Y-Axis: The vertical line representing numerical values.
    • Data Points: The dots plotted where the X and Y coordinates meet.
    • Line Path: The segment connecting points, showing the direction of change.
  • Types:
    • Trend-focused: Demonstrating an increase or decrease over time.
    • Comparison-focused: Showing how two different variables relate.
  • Example: A table showing “Hours of Sunlight”; the student plots the points and draws a line to track trends.

How Does a Line Graph Worksheet Work?

  1. Analyze Data: Read the provided table or list of information.
  2. Plotting: Locate the X-value and move up to the Y-value to mark a point.
  3. Connecting: Draw lines from one dot to the next in order.
  4. Interpretation: Answer questions about the slope (e.g., “When was the value highest?”).

Benefits of Learning About Line Graphs

  • Visual Thinking: Transforms numbers into a clear “story” of change.
  • Pattern Recognition: Helps children identify growth, decline, or stability.
  • Foundation for Algebra: Introduces coordinate systems early.
  • Critical Thinking: Encourages students to analyze why data changes.

Learning Objectives

  • Correctly label axes based on data.
  • Plot data points accurately.
  • Interpret trends shown by a line graph.
  • Organize information clearly and logically.

Worksheet Instructions

  1. Read the Data: Review the provided table.
  2. Label the Axes: Place categories on the bottom and numbers on the side.
  3. Draw Points: Mark each point with a small “X” or dot.
  4. Connect the Dots: Use a ruler to connect your points.
  5. Review: Check if your graph accurately reflects the data table.

Vocabulary Words

  • Data: Facts or statistics collected for analysis.
  • Axis (Plural: Axes): Fixed reference lines for measurement.
  • Coordinate: A set of numbers used to locate a point on a grid.
  • Trend: The general direction in which something is changing.
  • Plot: To mark a point on a graph.

Real-Life Applications

  • Weather Tracking: Monitoring temperature changes over a week.
  • Personal Progress: Tracking daily reading minutes.
  • Financial Literacy: Understanding how savings grow.
  • Sports: Tracking score progression during a game.

FAQs

Q1. Why use a line graph instead of a bar graph?

Answer: Line graphs are best for showing change over time, while bar graphs are better for comparing distinct groups.

Q2. What if the points don’t connect in a straight line?

Answer: That is normal! It simply shows that the data fluctuated.

Q3. Can my child use these worksheets without a ruler?

Answer: Yes, but a ruler helps emphasize that graphs represent precise relationships.

Q4. At what age should kids start plotting graphs?

Answer: Grade 2 is the ideal time to move from basic bar graphs to simple line graphs.

These Draw Line Graph Worksheets for Grade 2 encourage students to organize data, plot points, and create simple line graphs. Engaging exercises build graphing skills, improve data understanding, and develop confidence in presenting information visually. Inspire young learners with printable worksheets, essays, quizzes, paragraphsflashcards, and interactive resources. Stay connected on FacebookTelegram, and YouTube.

Our Content Team created this worksheet to support enriched education.

Reviewed By Kartik

Read More:

About the Author

Content Team

Kidpid Content Team is a team of experienced educators, curriculum researchers, and child-focused content creators specializing in early childhood and primary education. The team develops high-quality, research-based worksheets, learning activities, and educational articles aligned with age-appropriate learning standards. Every resource is carefully reviewed to ensure accuracy, clarity, and educational value, making Kidpid a trusted platform for parents, teachers, and schools worldwide.

View All Articles