


Filling out a probability chart with fractions, decimals, and percentages helps sixth graders understand how these forms of representation relate to each other. This worksheet guides you in completing the chart by converting and matching values, strengthening your grasp of probability. Practicing these conversions will enhance your skills in interpreting and applying probability concepts effectively.
[Scroll Down for Download Link]
Contents
- Complete The Probability Chart By Filling Out The Missing Values
- Key Facts About the Worksheet
- Parts/Types and Examples
- How Does this Worksheet Work?
- Benefits of Learning About Probability Charts
- Learning Objectives
- Worksheet Instructions
- Interesting Facts About Probability Charts
- Vocabulary Words
- Real-Life Applications
- FAQs
- Q1. What is a probability chart?
- Q2. Why should students learn probability conversions?
- Q3. What grade level is this worksheet designed for?
- Q4. How are fractions converted into percentages?
- Q5. Why are decimals used in probability?
- Q6. Can probability be greater than 100%?
- Q7. How do probability worksheets improve math skills?
Complete The Probability Chart By Filling Out The Missing Values
Read More: Fractions Activity Sort Worksheets

- A green card
- As a fraction – 9/16
- As a decimal – 0.5625
- As a percentage – 56.25%
- A yellow card
- As a fraction – 1/8
- As a decimal – 0.125
- As a percentage – 12.5%
- An even-numbered card
- As a fraction – 1/2
- As a decimal – 0.5
- As a percentage – 50%
- A card with a number less than or equal to 12
- As a fraction – 3/4
- As a decimal – 0.75
- As a percentage – 75%
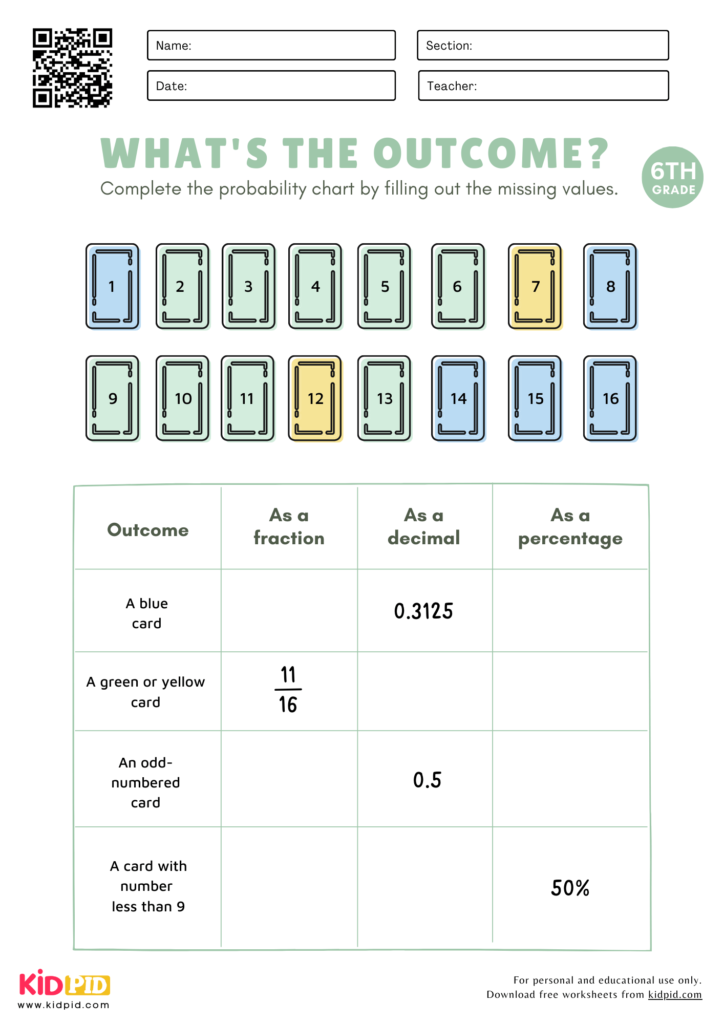
- A blue card
- As a fraction – 5/16
- As a decimal – 0.3125
- As a percentage – 31.25%
- A green or yellow card
- As a fraction – 11/16
- As a decimal – 0.6875
- As a percentage – 68.75%
- An odd-numbered card
- As a fraction – 1/2
- As a decimal – 0.5
- As a percentage – 50%
- A card with a number less than 9
- As a fraction – 1/2
- As a decimal – 0.5
- As a percentage – 50%
Key Facts About the Worksheet
A Probability Chart with Fractions, Decimals, and Percentages Worksheet helps Grade 6 students understand probability by expressing the same likelihood in three different mathematical forms. These worksheets strengthen number sense and develop skills in converting between fractions, decimals, and percentages. Students learn to compare probabilities, identify likely and unlikely events, and interpret probability values accurately. The activities are aligned with middle school math standards and support real-world problem-solving.
Parts/Types and Examples
Parts of the Worksheet
- Probability chart table
- Fraction column
- Decimal column
- Percentage column
- Conversion exercises
- Word problems and probability scenarios
Types of Activities
- Fill-in-the-chart exercises
- Fraction-to-decimal conversions
- Decimal-to-percentage conversions
- Event probability comparisons
- Real-life probability questions
Examples
- 1/2 = 0.5 = 50%
- 1/4 = 0.25 = 25%
- 3/4 = 0.75 = 75%
- 1/10 = 0.1 = 10%
How Does this Worksheet Work?
Students examine probability values presented as fractions, decimals, or percentages and complete the missing forms. They convert numbers using mathematical relationships and compare the likelihood of different events. Some worksheets include spinners, dice, cards, or real-life scenarios to help students visualize probability. Through repeated practice, learners develop fluency in converting and interpreting probability data accurately.
Benefits of Learning About Probability Charts
- Improves understanding of probability concepts
- Strengthens fraction, decimal, and percentage conversion skills
- Develops logical and analytical thinking
- Enhances data interpretation abilities
- Builds confidence in solving real-world math problems
- Supports success in higher-level statistics and probability topics
Learning Objectives
By completing this worksheet, students will be able to:
- Define probability and likelihood
- Convert fractions into decimals and percentages
- Convert decimals into fractions and percentages
- Compare probabilities of different events
- Interpret probability charts correctly
- Apply probability concepts to everyday situations
Worksheet Instructions
- Read each probability value carefully.
- Complete the missing fraction, decimal, or percentage.
- Show your calculations when required.
- Check that all conversions are equivalent.
- Compare probabilities and answer follow-up questions.
- Review your answers for accuracy before submitting.
Interesting Facts About Probability Charts
- Probability values always range from 0 to 1.
- A probability of 0 means an impossible event.
- A probability of 1 means a certain event.
- Percentages express probability out of 100.
- Fractions, decimals, and percentages can represent the same likelihood.
- Probability is widely used in science, sports, finance, and weather forecasting.
Vocabulary Words
- Probability
- Likelihood
- Fraction
- Decimal
- Percentage
- Event
- Outcome
- Chance
- Certain
- Impossible
- Conversion
- Equivalent Value
- Sample Space
- Prediction
- Data Analysis
Real-Life Applications
Probability charts are used in many everyday situations, including:
- Predicting weather conditions
- Analyzing sports statistics
- Understanding insurance risks
- Conducting scientific experiments
- Playing board games and card games
- Making business and financial decisions
- Evaluating survey and poll results
These practical applications help students connect classroom learning to real-world decision-making.
FAQs
Q1. What is a probability chart?
Answer: A probability chart is a table that shows probability values using fractions, decimals, and percentages to help compare and understand chances of events.
Q2. Why should students learn probability conversions?
Answer: Learning conversions helps students represent probability in multiple forms and strengthens overall mathematical understanding.
Q3. What grade level is this worksheet designed for?
Answer: This worksheet is primarily designed for Grade 6 students but can also benefit Grades 5–7 depending on skill level.
Q4. How are fractions converted into percentages?
Answer: Divide the numerator by the denominator to get a decimal, then multiply by 100 to find the percentage.
Q5. Why are decimals used in probability?
Answer: Decimals provide a precise way to represent the likelihood of an event and make comparisons easier.
Q6. Can probability be greater than 100%?
Answer: No. Probability cannot exceed 100% because 100% represents certainty.
Q7. How do probability worksheets improve math skills?
Answer: They strengthen critical thinking, number conversions, data interpretation, and problem-solving abilities while reinforcing essential math concepts.
Probability Chart with Fractions, Decimals, and Percentages Worksheets help Grade 6 students compare number forms and understand probability concepts. These engaging activities strengthen mathematical reasoning, problem-solving, and real-world application skills. Unlock engaging learning with worksheets, essays, paragraphs, flashcards, quizzes, and interactive resources on our website. Stay connected with us on YouTube & Facebook.
The Content Team created this worksheet to support lesson learning.
Reviewed By Chaitrali Shelar
Read More:



