

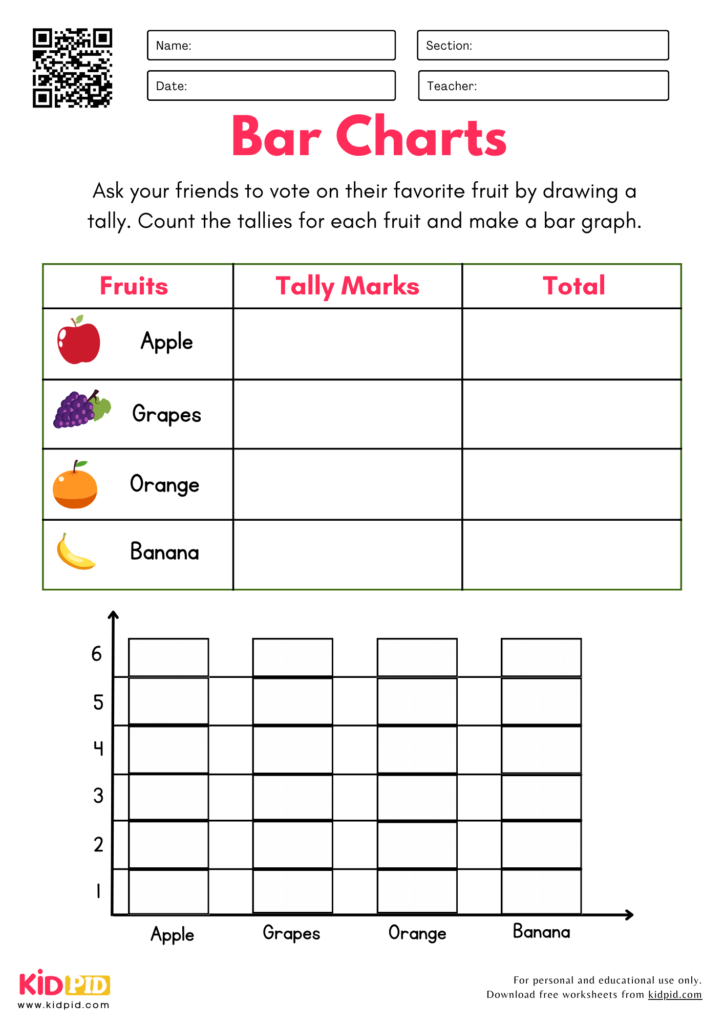
Today, the first-grade students will learn about the data collection and bar chart worksheet. They have to ask their friends to vote on their favorite fruit by drawing a tally. Afterward, count the tallies for each food item and make a bar graph below the table. So check out these worksheets and learn to draw bar graphs by collecting the data on fruits and food items.

[Scroll Down for Download Link]

Data Collection & Bar Chart Worksheet Activities For Grade 1

Read More: Bar Graphs Printable Worksheets for Grade 2
Data Collection & Bar Chart Worksheet For Grade 1

In this data collection and bar chart worksheet. Students have to ask their friends to vote on their favorite fruit by drawing a tally. Afterward, they will count the tallies for each fruit item and make a bar graph according to the number of tallies below the table.
Data Collection & Bar Chart Worksheet For Grade 1

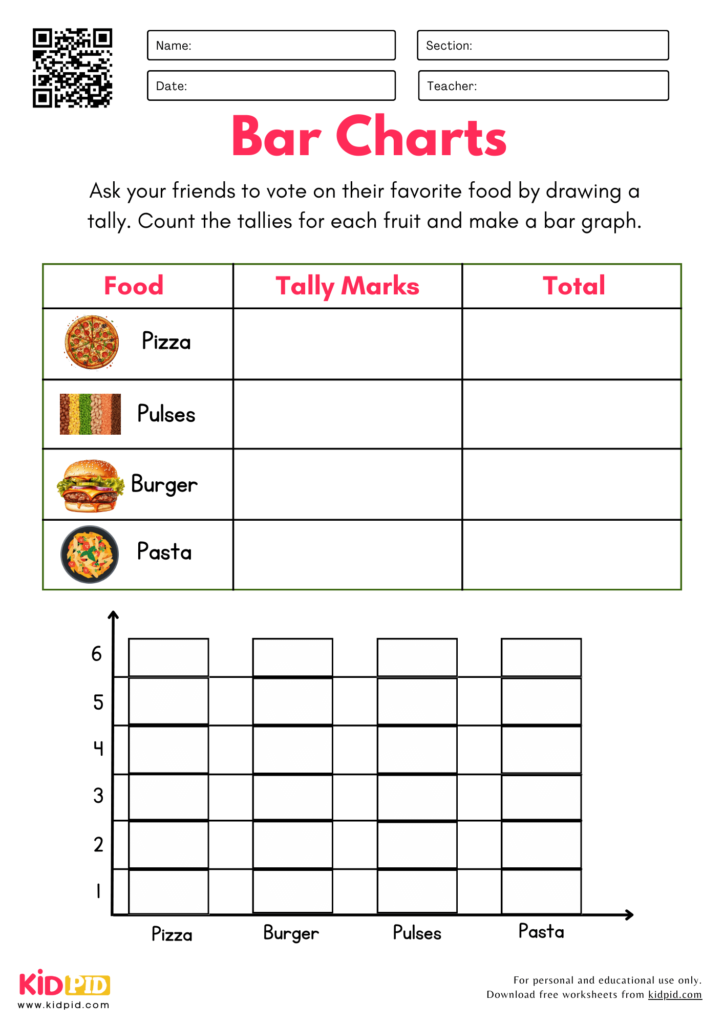
First-grade students will practice the data collection and bar chart worksheet. They will ask their friends to vote on their favorite food by drawing a tally. Afterward, they will count the tallies for each food item and make a bar graph according to the number of tallies below the table.

Key Facts About Data Collection & Bar Chart Worksheets

  • Target Audience: Designed specifically for first-grade students (approx. ages 6-7).
  • Core Skill: Bridges the gap between gathering raw information and visual representation.
  • Methodology: Utilizes a three-step pedagogical approach: Tallying, Counting, and Graphing.
  • Educational Alignment: Supports early mathematics curricula focused on data representation, sorting, and classification.
  • Interactive Nature: Encourages social learning by requiring students to interact with peers to collect votes.

Parts of a Data Collection Bar Chart Worksheet

To complete these worksheets, students work with two primary components:

  1. The Tally Table: A structured section where students record responses (votes) using tally marks (vertical lines). This introduces the concept of grouping and counting by fives.
  2. The Bar Graph Grid: A visual area containing an X-axis (the categories) and a Y-axis (the number of votes). Students fill in the bars to represent the totals gathered in the table.

How Does the Data Collection Worksheet Work?

The process follows a simple, repeatable cycle that reinforces scientific observation and math skills:

  1. Surveying: Students ask friends or family members to choose their favorite from a set of options.
  2. Recording: For every vote received, the student records a tally mark in the designated table row.
  3. Summation: Students count the total tallies for each item.
  4. Visualization: Using the totals, students color or draw bars on the graph to create a clear visual representation of popularity.

Benefits of Learning About Data Collection and Bar Charts

  • Logical Thinking: Teaches children how to organize information systematically.
  • Mathematical Foundation: Provides a hands-on introduction to statistics and arithmetic.
  • Visual Literacy: Helps students quickly interpret information at a glance.
  • Communication Skills: Promotes confidence as students engage in surveys and present their findings.

Learning Objectives

By the end of this activity, students will be able to:

  • Collect categorical data through simple surveys.
  • Correctly use tally marks to keep an accurate record of counts.
  • Transfer numerical data from a table into a bar graph.
  • Identify which category has the highest (most) and lowest (least) frequency.

Worksheet Instructions

  1. Preparation: Print the worksheet and prepare a pencil and coloring tools.
  2. The Survey: Ask your peers or family members to pick their favorite from the listed options.
  3. Tallying: Write a tally mark in the “Tally” column for every vote given.
  4. Counting: Add up the tally marks and write the number in the “Total” column.
  5. Graphing: On the bar graph provided, color in one box for every vote counted to complete the bar for each item.

Interesting Facts About Bar Charts

  • History: The bar graph is one of the oldest forms of data visualization, used for centuries to help people understand comparisons.
  • Why Bars? Bars are used because the length makes it instantly obvious which value is larger or smaller.
  • Universal Language: Bar charts are used everywhere—from financial reports to news articles and weather forecasts.

Vocabulary Words

  • Data: Information collected from observations or questions.
  • Tally Mark: A simple vertical line (often crossed for groups of five) used to keep count.
  • Bar Graph: A chart that uses bars of different lengths to compare information.
  • Survey: A method of gathering information by asking questions to a group.
  • Category: A specific group or item being counted.

Real-Life Applications

  • Classroom Decisions: Choosing a class pet or favorite lunch item.
  • Weather Tracking: Counting sunny, cloudy, and rainy days.
  • Shopping: Comparing different types of fruits in a basket.
  • Sports: Tracking scores or points achieved during games.

FAQs

Q1. At what age should a child start learning to make bar charts?

Answer: Most children are introduced to basic data collection and simple graphing in 1st grade.

Q2. Why do we use tally marks instead of just writing numbers?

Answer: Tally marks help students practice counting in groups and allow for real-time recording without needing to erase numbers as the count changes.

Q3. Can I use this worksheet for younger children?

Answer: Yes, with adult guidance, younger children can practice counting and coloring the bars.

Collecting information and turning it into bar charts gives Grade 1 students a fun introduction to data handling. These worksheets build counting, organizing, graphing, and observation skills through simple, engaging activities. Encourage active learning with printable essays, worksheets, quizzes, paragraphsflashcards, and interactive resources. Stay connected on Facebook,  Telegram, and YouTube.

Our Content Team made this worksheet to enhance students’ overall learning experience.

Reviewed By Sandra K Udayan

Read More:

About the Author

Content Team

Kidpid Content Team is a team of experienced educators, curriculum researchers, and child-focused content creators specializing in early childhood and primary education. The team develops high-quality, research-based worksheets, learning activities, and educational articles aligned with age-appropriate learning standards. Every resource is carefully reviewed to ensure accuracy, clarity, and educational value, making Kidpid a trusted platform for parents, teachers, and schools worldwide.

View All Articles