
A pictograph is a representation of data with the help of images. Second-graders have to analyze the pictograph about how many people have voted. Based on the pictograph data, they will answer the given questions correctly in the blanks. So check out these worksheets and practice the questions to learn to analyze data. The pictograph worksheet will generate interest among kids.
[Scroll Down for Download Link]
Contents
- Analyze The Pictograph Worksheets For Grade 2
- Key Facts About Pictograph Worksheets for Grade 2
- Parts, Types, and Examples of Pictographs
- How Does a Pictograph Worksheet Work?
- Benefits of Learning About Pictographs
- Learning Objectives
- Worksheet Instructions
- Interesting Facts About Pictographs
- Vocabulary Words
- Real-Life Applications
- FAQs
Analyze The Pictograph Worksheets For Grade 2
Read More: Rounding 3 Digit Numbers to Nearest 100 Worksheet For Grade 3

Q. How many people like pizza?
Ans. 6
Q. Which two foods have the same number of votes?
Ans. Noodles and Burger
Q. Which has the fewest votes?
Ans. Pasta
Q. Which is most loved by people?
Ans. French fries
Q. Write the number of votes French fries have.
Ans. 7
This is a pictograph worksheet for second-grade students. A group of people voted for their favorite junk food and drew a pictograph, so answer the questions correctly based on the given pictograph. It includes an answer key for the students to correct their mistakes.
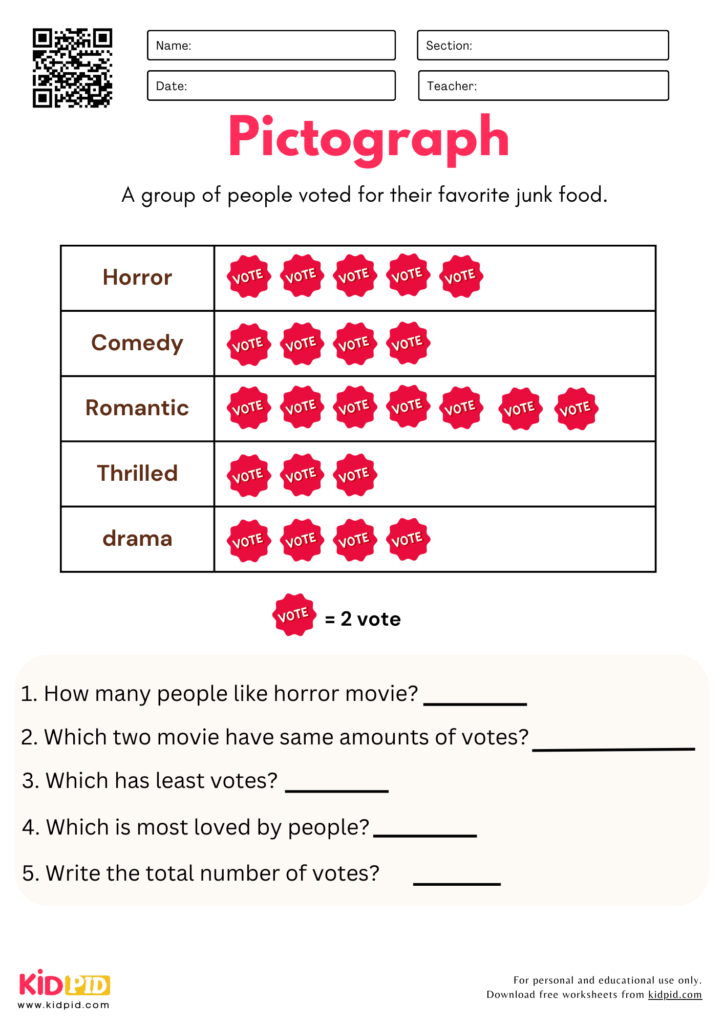
Q. How many people like horror movies?
Ans. 10
Q. Which two movies have the same number of votes?
Ans. Comedy and Drama
Q. Which has the fewest votes?
Ans. Thrilled
Q. Which is most loved by people?
Ans. Romantic
Q. Write the total number of votes?
Ans. 46
Students will practice the pictograph data in this worksheet. They will answer the given questions based on the group of people who voted for their favorite type of movie and create a pictograph. It consists of an answer key for the correction and completion of the worksheet.
Understanding the structure of a pictograph is the first step toward mastery.
A pictograph worksheet acts as a bridge between looking at a picture and understanding numerical data.
By completing these worksheets, students will be able to:
Answer: Without the key, you wouldn’t know if one symbol equals 1, 5, or 100 items. It is the rulebook for the graph.
Answer: Yes, these worksheets are designed to be accessible, but they can be scaled in difficulty by changing the value represented by each symbol (e.g., from 1 to 5).
Answer: Encourage them to count the symbols one by one and write the numerical value next to each category before attempting to answer the questions.
Key Facts About Pictograph Worksheets for Grade 2
Parts, Types, and Examples of Pictographs
How Does a Pictograph Worksheet Work?
Benefits of Learning About Pictographs
Learning Objectives
Worksheet Instructions
Interesting Facts About Pictographs
Vocabulary Words
Real-Life Applications
FAQs
Q1. Why is the “Key” so important?
Q2. Are these worksheets suitable for all Grade 2 students?
Q3. What should I do if my child struggles with math?

These Pictograph Worksheets for Grade 2 help students read, create, and interpret pictographs with confidence. Engaging activities strengthen counting, data analysis, comparison, and graph-reading skills while making math enjoyable through colorful visual learning. Keep learning exciting with printable worksheets, essays, quizzes, paragraphs, flashcards, and interactive resource materials. Join us on Telegram, YouTube, and Facebook.
Our Content Team created this worksheet to elevate student learning.
Reviewed By Minakshi
Read More: