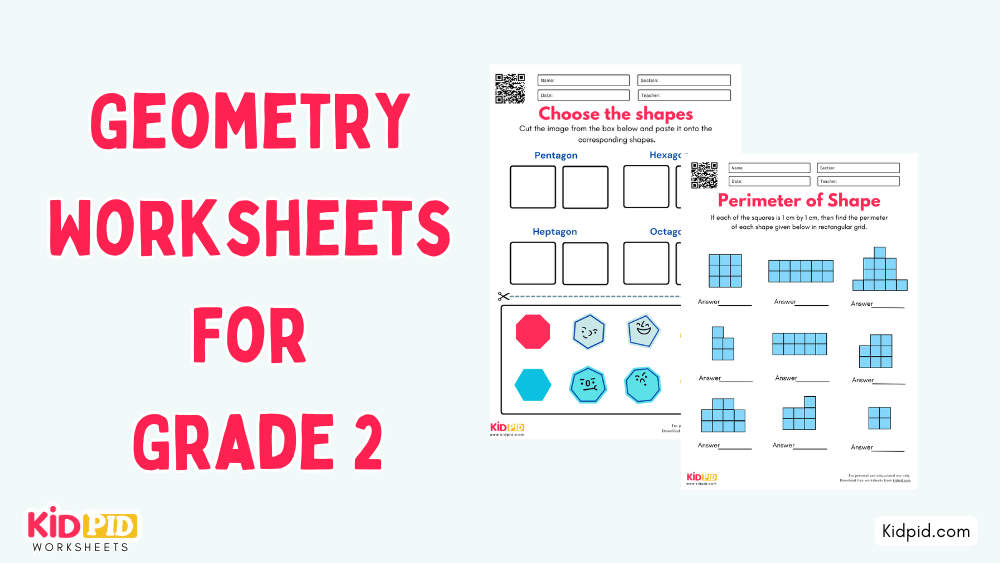
This is a bar chart worksheet for second-grade students in which they will create bar charts and analyze them. Bar charts help to collect data and analyze it effectively. They will answer the questions based on the given data in the bar charts. So check out these worksheets and enhance your ability to create a bar chart and examine its data. Enjoy the activity and have fun!

[Scroll Down for Download Link]

Create & Analyze Bar Chart Worksheet Activities For Grade 2

Read More: Bar Graphs Printable Worksheets for Grade 2

Create Bar Chart & Analyze Worksheet For Grade 2


Q. Which flavor sold the most?
Ans. Chocolate

Q. Which flavor sold the least?
Ans. Butterscotch

Q. How many cones of vanilla and chocolate flavor together were sold?
Ans. 9

Q. How many cones were sold in all?
Ans. 14

In this bar chart worksheet, students have to create a bar chart based on the ice cream parlor that recorded the number of ice cream cones sold. After making a bar graph, they will write the answers according to the questions. It includes an answer key for correction and completion of the worksheet.
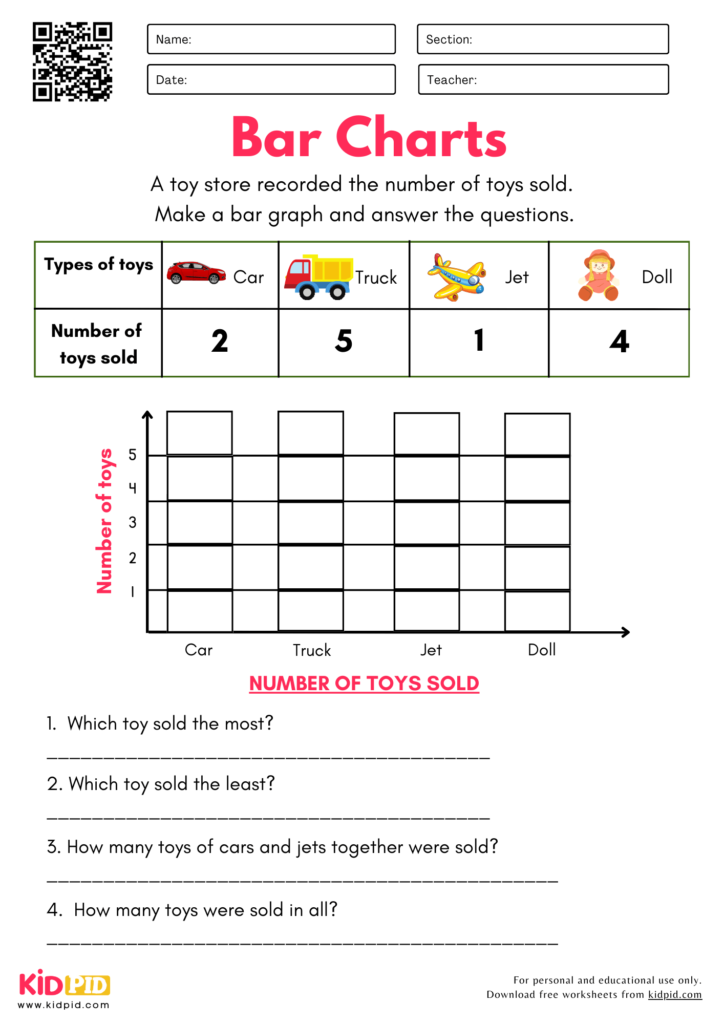
Create Bar Chart & Analyze Worksheet For Grade 2


Q. Which toy sold the most?
Ans. Truck

Q. Which toy sold the least?
Ans. Jet

Q. How many toy cars and jets together were sold?
Ans. 3

Q. How many toys were sold in all?
 Ans. 12

Students will practice the bar chart worksheet, in which they have to create a bar chart based on the toy store that records the number of toys sold. Afterward, they will write the answers to the given questions on the worksheet. Students can take hints from the answer key.

Key Facts About Create Bar Chart & Analyze Worksheets

  • Target Audience: Specifically designed for 2nd-grade students (ages 7–8) who are developing foundational data literacy skills.
  • Educational Purpose: These worksheets bridge the gap between simple counting and complex statistical analysis.
  • Skill Development: They promote critical thinking, spatial reasoning, and numerical fluency.
  • Aligned with Standards: Often supports core math curriculum goals related to Data and Graphing.
  • Dual-Action Approach: Students are tasked with both the construction of the graph (drawing bars) and the interpretation of the graph (answering analysis questions).

Parts/Types/Examples of Bar Chart Worksheets

  • Parts of a Bar Chart: Every worksheet reinforces the essential anatomy of a graph:
    • Title: Tells us what the data is about.
    • X-axis (Horizontal): Shows the categories (e.g., flavors of ice cream, types of toys).
    • Y-axis (Vertical): Shows the scale or the frequency (the number of items).
    • Bars: The visual representation of the quantity.
  • Examples of Activities:
    • Categorical Data: Mapping favorite colors, fruits, or animals.
    • Store Inventory Tracking: Counting sales of items to see which are most and least popular.

How Does the Create Bar Chart & Analyze Worksheet Work?

  1. Data Intake: The student receives a set of raw data (e.g., a table listing items sold).
  2. Visualization: The student translates numerical data into a bar graph, practicing drawing bars to reach the correct unit level.
  3. Critical Analysis: Once the graph is drawn, students apply analytical skills to interpret the visual information.
  4. Problem Solving: Students answer quantitative questions, such as “Which had the most?” or calculate totals.
  5. Self-Correction: The answer key allows students to verify their work and understand mistakes immediately.

Benefits of Learning About Bar Chart Analysis

  • Visual Literacy: Helps children understand that complex information can be simplified into visual shapes.
  • Comparison Skills: Teaches kids how to compare “more than,” “less than,” and “equal to” in a visual context.
  • Early Statistical Thinking: Builds a foundation for more advanced data science topics later in school.
  • Logical Reasoning: Encourages students to look for trends and outliers in a set of numbers.

Learning Objectives

By completing these worksheets, students will be able to:

  • Accurately transfer numerical data into a bar graph format.
  • Label graph components (axes and titles) correctly.
  • Interpret data to solve simple addition and subtraction word problems.
  • Compare categorical data to identify trends.

Worksheet Instructions

  1. Review the Data: Read the table to understand the categories and values.
  2. Draw the Bars: Use a guide to draw bars that correspond exactly to the number provided.
  3. Labeling: Ensure the title and axes are clearly identified.
  4. Analyze: Read the follow-up questions at the bottom.
  5. Check Your Work: Compare your graph and answers with the answer key.

Interesting Facts About Bar Charts

  • Historical Origin: William Playfair is widely credited with inventing the bar chart in the 18th century.
  • The Power of Color: Using different colors for bars makes it easier for the brain to process data sets quickly.
  • Universal Language: Bar charts are used everywhere—from weather reports to business—because they are the fastest way to convey a comparison.

Vocabulary Words

  • Data: Pieces of information, often represented by numbers.
  • Frequency: How often a specific item appears.
  • Category: A group or type of items being compared.
  • Scale: The sequence of numbers used on the Y-axis to measure data.
  • Axis: The horizontal or vertical lines that provide the frame for the graph.

Real-Life Applications

  • Classroom Management: Voting for a class pet or field trip destination.
  • Grocery Shopping: Keeping track of fruit consumption each week.
  • Sports: Seeing how many points a favorite team scored in a series of games.
  • Budgeting: Understanding spending on different types of school supplies.

FAQs

Q1. Can these worksheets be used for remote learning?

Answer: Yes, these are printable and ideal for independent practice at home or in a virtual classroom.

Q2. Should children use a ruler for these charts?

Answer: Yes, using a ruler helps develop fine motor skills and ensures the bars are neat, which is crucial for accuracy.

Q3. Why do these worksheets include an answer key?
Answer: It empowers students to practice self-assessment, helping them identify where they may have miscounted.

These Create Bar Chart & Analyze Worksheets for Grade 2 help students organize data, draw bar graphs, and answer questions using their charts. Fun activities strengthen graphing, data interpretation, critical thinking, and problem-solving skills through engaging practice. Enhance every learning session with printable paragraphs, essays, quizzesworksheetsflashcards, and interactive resources. Connect with us on Facebook, Telegram, and YouTube.

This worksheet is designed by our Content Team to encourage meaningful learning.

Reviewed By Manpreet Kaur

Read More:

About the Author

Content Team

Kidpid Content Team is a team of experienced educators, curriculum researchers, and child-focused content creators specializing in early childhood and primary education. The team develops high-quality, research-based worksheets, learning activities, and educational articles aligned with age-appropriate learning standards. Every resource is carefully reviewed to ensure accuracy, clarity, and educational value, making Kidpid a trusted platform for parents, teachers, and schools worldwide.

View All Articles