Bar charts are charts that categorize data in a graphical manner. It helps to analyze the data effectively and efficiently. This bar chart activity is designed for second-grade students to learn about bar graphs. They will analyze them and answer the given questions in the worksheets. Check out these amazing bar charts and enhance your knowledge.
[Scroll Down for Download Link]
Contents
Analyze The Bar Graph Worksheet Activities For Grade 2
Read More: Probability Chart with Fractions, Decimals, and Percentages Worksheet for Grade 6

Q. How many days were sunny?
Ans. 3
Q. How many days were rainy?
Ans. 6
Q. How many fewer rainy days were there than windy days?
Ans. 2
Q. How many days were cloudy?
Ans. 4
Q. How many more cloudy days were there than windy days?
Ans. 1
This is a bar chart worksheet for second-grade students to analyze the bar graph and the data given in the worksheet. Students have to give answers to questions according to the data. It also includes an answer sheet for the students to correct the mistakes.
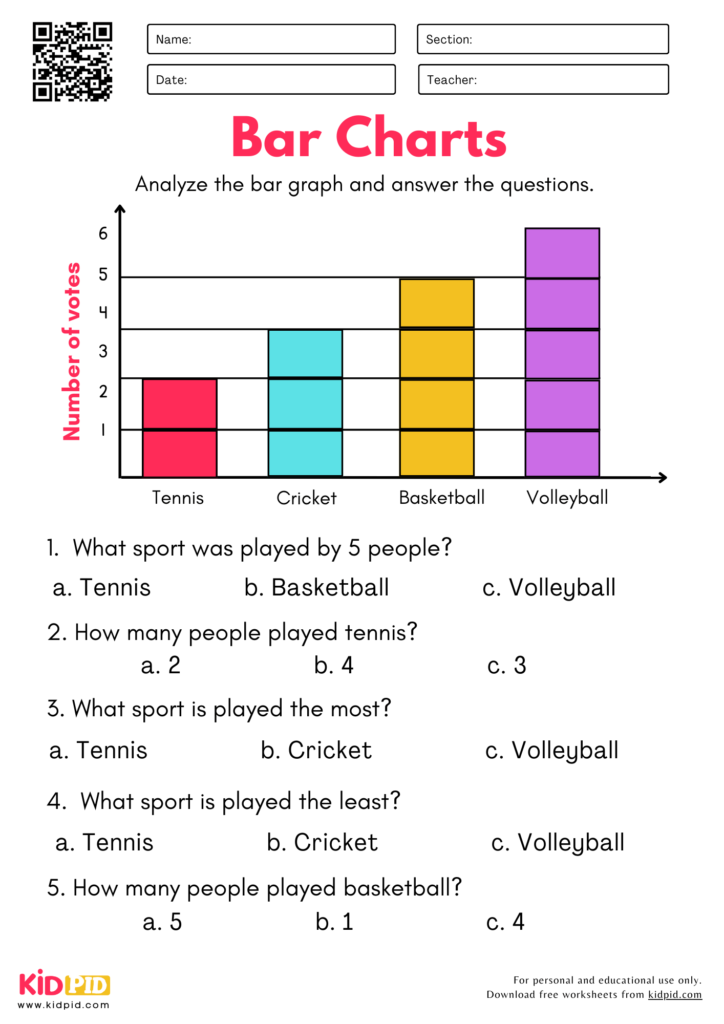
Q. What sport was played by 5 people?
Ans. Basketball
Q. How many people played tennis?
Ans. 2
Q. What sport is played the most?
Ans. Volleyball
Q. What sport is played the least?
Ans. Tennis
Q. How many people played basketball?
Ans. 4
In this bar chart worksheet, students will practice analyzing data from the bar graph and answering the questions given in the worksheet. It also consists of an answer key for the students to complete the worksheet accurately.
To analyze a bar chart effectively, students must understand its core components:
Answer: Typically 1st or 2nd grade, once they grasp counting and basic addition/subtraction.
Answer: It provides a structured, independent way to practice math.
Answer: Have them write the numeric value next to each bar first to make comparisons easier.
Key Facts About Analyzing Bar Chart Worksheets for Grade 2
Parts, Types, and Examples
How the Worksheet Works
Benefits of Learning Bar Chart Analysis
Learning Objectives
Worksheet Instructions
Interesting Facts
Vocabulary
Real-Life Applications
FAQs
Q1. At what age should a child start?
Q2. Why is this useful for home study?
Q3. What if they struggle with subtraction?

These Analyze the Bar Chart Worksheets for Grade 2 help students practice reading, comparing, and interpreting bar graphs. Interactive activities strengthen data analysis, logical thinking, and problem-solving skills while making graph learning simple, engaging, and enjoyable. Turn every lesson into a fun experience with printable essays, quizzes, paragraphs, worksheets, flashcards, and interactive resources. Join our Telegram, YouTube, and Facebook communities.
This worksheet is thoughtfully developed by our Content Team to enhance learning.
Reviewed By Madhulika
Read More: